Meet Mian
A new way to visualize, analyse, and train machine learning models on the microbiome. Built by the research community for the research community.
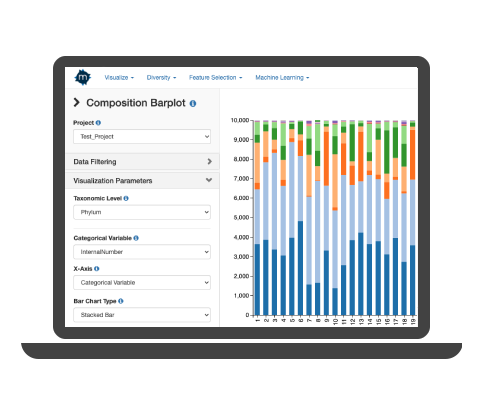
Easily see trends and patterns in the form of bar charts, scatterplots, PCA, NMDS, composition pie charts, tree plots, and more.
View key alpha and beta diversity results in the context of gene expression, host response, or any other related metadata.
Run feature selection algorithms like Boruta and train machine learning models like linear regression or deep neural networks.
Find relationships between changes in the microbiome and changes in the immune cell infiltration, gene expression, or other measured response.
Pick and choose to use different levels of filtering of your data.
Research should be accessible to everyone, always.
Get meaningful results by automatically or manually subsampling the microbiome data.